
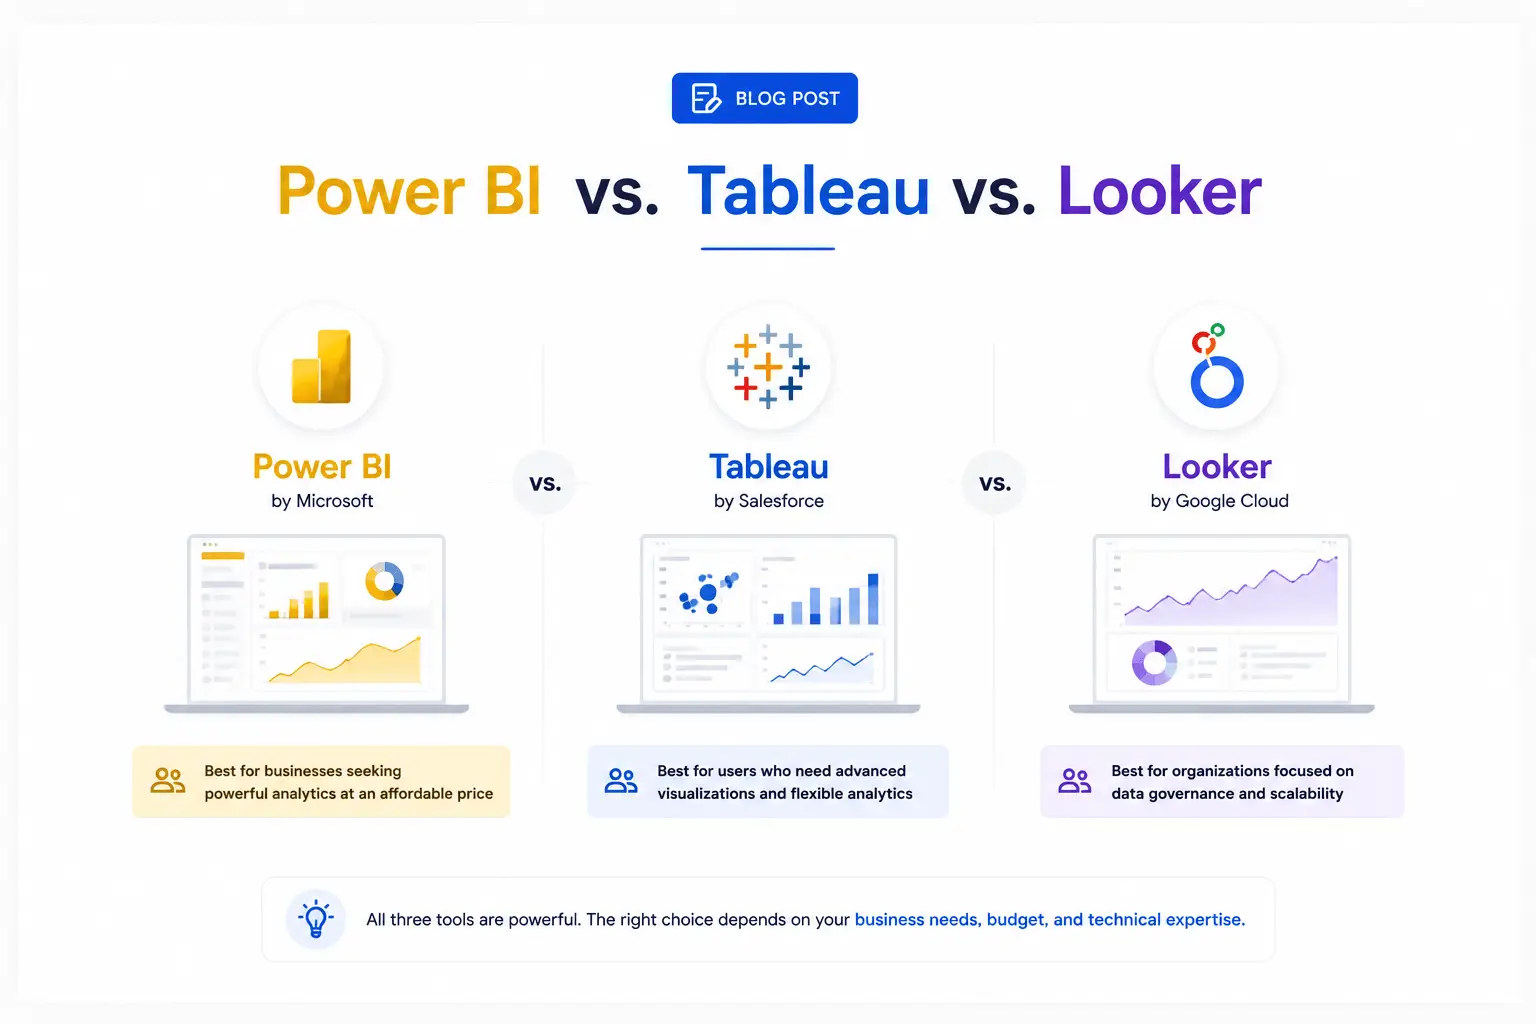
Choosing the right business intelligence platform in 2026 is one of the most consequential technology decisions a data-driven organization can make. With the BI market flooded with options, three platforms consistently rise to the top: Microsoft Power BI, Tableau, and Looker (now part of Google Cloud). Each tool comes with distinct strengths, pricing models, AI capabilities, and integration ecosystems that make them better suited to different business contexts.
At Techlooker, our data visualization and analytics consulting services team has deployed all three platforms across 500+ client projects in North America. This guide breaks down exactly what each tool does best and which one belongs in your analytics stack.
Why the Right BI Tool Choice Matters More Than Ever
The wrong BI platform choice costs businesses far more than a subscription fee. It costs analyst time, executive trust, adoption rates, and ultimately ROI. Organizations that deploy Power BI when their data architecture lives natively in Google Cloud or choose Tableau for a team without the bandwidth to maintain it consistently report poor adoption and underperforming dashboards.
A 2026 Gartner survey found that 62% of organizations that reported poor data analytics ROI attributed the failure to tool mismatch, not data quality issues. The tool has to fit your people, your data stack, and your business objectives simultaneously.
The good news: Power BI, Tableau, and Looker are all excellent platforms when deployed in the right context. The question is never “which tool is best” it’s “which tool is best for us.”
Microsoft Power BI: The Enterprise Standard for Microsoft Shops
Power BI is the dominant force in the North American BI market, commanding over 30% of market share in 2026. It’s the go-to choice for organizations already embedded in the Microsoft ecosystem Azure, Office 365, Teams, SharePoint, Dynamics 365, and SQL Server.
Where Power BI Excels
- Cost-effectiveness: Power BI Pro at $10/user/month is dramatically cheaper than Tableau or Looker at equivalent scale
- Microsoft integration: Native connectors to Azure Data Factory, Azure Synapse, Teams, and SharePoint make data pipelines seamless
- Copilot AI features: Power BI Copilot now generates DAX measures, creates report summaries, and answers natural language questions directly in dashboards
- Self-service adoption: Business users with Excel familiarity ramp up quickly on Power BI’s drag-and-drop interface
- Enterprise governance: Row-level security, workspace management, and deployment pipelines are mature and well-documented
Power BI’s primary weakness is visual design flexibility. Custom, pixel-perfect visualizations often require third-party visuals or significant DAX expertise. For organizations that prioritize aesthetic differentiation, Power BI’s default visuals can feel limiting.
Our Power BI consulting services team has cut reporting cycles by up to 70% for mid-market financial services clients using Power BI’s incremental refresh and automated alert features.
Tableau: The Data Storyteller’s Platform
Tableau built its reputation on the richness and flexibility of its visual analytics. In 2026, Tableau (now fully integrated with Salesforce’s Einstein AI) remains the preferred choice for organizations that prioritize data exploration, ad-hoc analysis, and visually compelling executive communication.
Where Tableau Excels
- Visualization depth: Tableau’s chart library and custom mark types are unmatched in the BI space
- Explore-and-discover workflows: Data analysts and scientists love Tableau’s ability to pivot and drill through data intuitively
- Salesforce native integration: For organizations running Salesforce CRM, Tableau CRM (Einstein Analytics) creates a seamless pipeline from CRM data to visual insight
- Tableau Pulse: AI-generated metric summaries delivered proactively via Slack or email a genuine innovation in 2025/2026
- Community and education: Tableau’s training ecosystem is the richest in the industry
Tableau’s key challenges are cost and governance complexity. Tableau Creator licenses run $70+/user/month a significant premium over Power BI. For large user bases requiring broad access, licensing costs escalate quickly. Governance and deployment pipelines, while improved, still lag Power BI’s enterprise maturity.
Looker (Google Cloud): The Developer-Centric Data Platform
Looker occupies a unique position in the BI landscape. Where Power BI and Tableau are primarily end-user BI tools, Looker is fundamentally a semantic layer and embedded analytics platform. Its LookML modeling language defines business logic once, centrally, ensuring every dashboard and every user works from the same governed data definitions.
Where Looker Excels
- Semantic layer: LookML prevents metric inconsistency across teams one definition of “revenue” that every dashboard uses
- Embedded analytics: Looker’s embedded BI API is the best-in-class solution for software companies building analytics into their own SaaS products
- Google Cloud native: BigQuery integration is unbeatable sub-second queries on petabyte datasets without moving data
- API-first architecture: Everything in Looker is accessible programmatically, enabling custom workflows and integrations
- dbt integration: The dbt + Looker stack is the modern data team’s preferred analytics architecture in 2026
Looker’s learning curve is steep. LookML requires developer investment to build and maintain. For business-user-led analytics programs without dedicated data engineers, Looker is often over-engineered. Pricing is also enterprise-tier, making it cost-prohibitive for smaller organizations.
2026 Comparison: Power BI vs. Tableau vs. Looker
Across our 500+ client engagements, these are the primary decision drivers we use in our free strategy sessions:
- Already on Microsoft Azure/Office 365 and need broad user access at low cost → Power BI
- Salesforce-centric or need premium data storytelling and exploration → Tableau
- Building embedded analytics or running a modern data stack on Google Cloud/BigQuery → Looker
- Need AI-generated narrative insights delivered proactively → Tableau Pulse or Power BI Copilot
- Have a small data team and need fast self-service BI → Power BI
Cost at 100 users (approximate 2026 pricing): Power BI Premium Per User ~$20/month = $2,000/month. Tableau Creator ~$70/month = $7,000/month. Looker is contract-based, typically starting at $3,000-$5,000/month for mid-market.
How AI Is Changing the BI Platform Landscape in 2026
All three platforms have made significant AI investments in 2025-2026. Power BI Copilot (Microsoft Azure OpenAI integration), Tableau Pulse (Salesforce Einstein), and Looker’s AI-powered NLQ all aim to make data exploration accessible to non-analysts through natural language querying. The result is a narrowing gap between platforms at the AI feature layer.
Where platforms still diverge significantly is in ML model integration. Looker’s integration with Google Vertex AI for embedding custom ML predictions into dashboards is currently the most seamless in the market. Power BI’s Azure ML connector follows closely. Tableau’s ML capabilities, while improving, still require more custom development for production model deployment.
Whichever platform you choose, success depends less on the tool and more on the strategy, architecture, and governance behind it. That’s exactly what Techlooker’s data visualization consulting services are designed to deliver. Our platform-agnostic team recommends the right BI tool for your specific data landscape and then builds it to perform.
Getting Started: Your Platform Selection Framework
If you’re evaluating BI platforms in 2026, use this five-question framework before committing to a vendor:
- What cloud infrastructure do you already run? (Azure → Power BI, Google Cloud → Looker, Salesforce → Tableau)
- Who are your primary dashboard consumers? (Business users → Power BI, Analysts → Tableau, Developers → Looker)
- Do you need embedded analytics inside your own product? (Yes → Looker)
- What’s your licensing budget per user at full scale?
- How mature is your data engineering team? (Strong → Looker, Mixed → Tableau, Business-led → Power BI)
Still unsure? Book a free 60-minute strategy session with Techlooker’s senior BI consultants. We’ll audit your current data landscape and give you an unbiased tool recommendation including a cost projection for your specific user count and use case. Visit our contact page to get started.